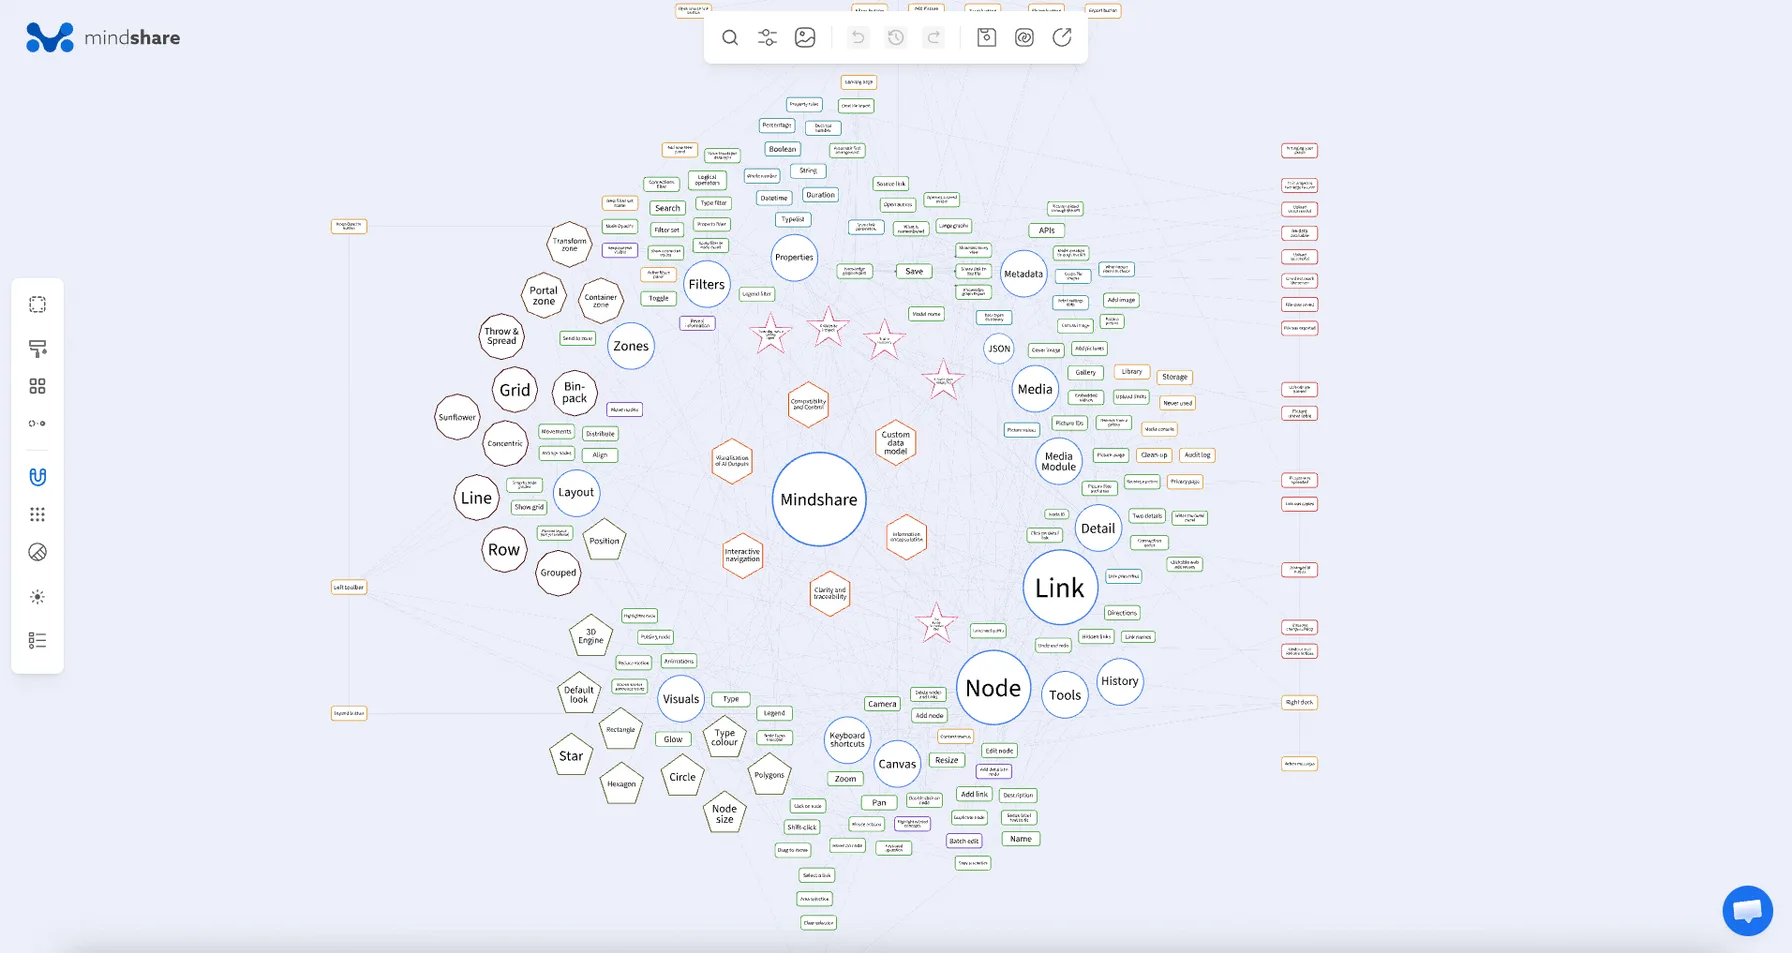
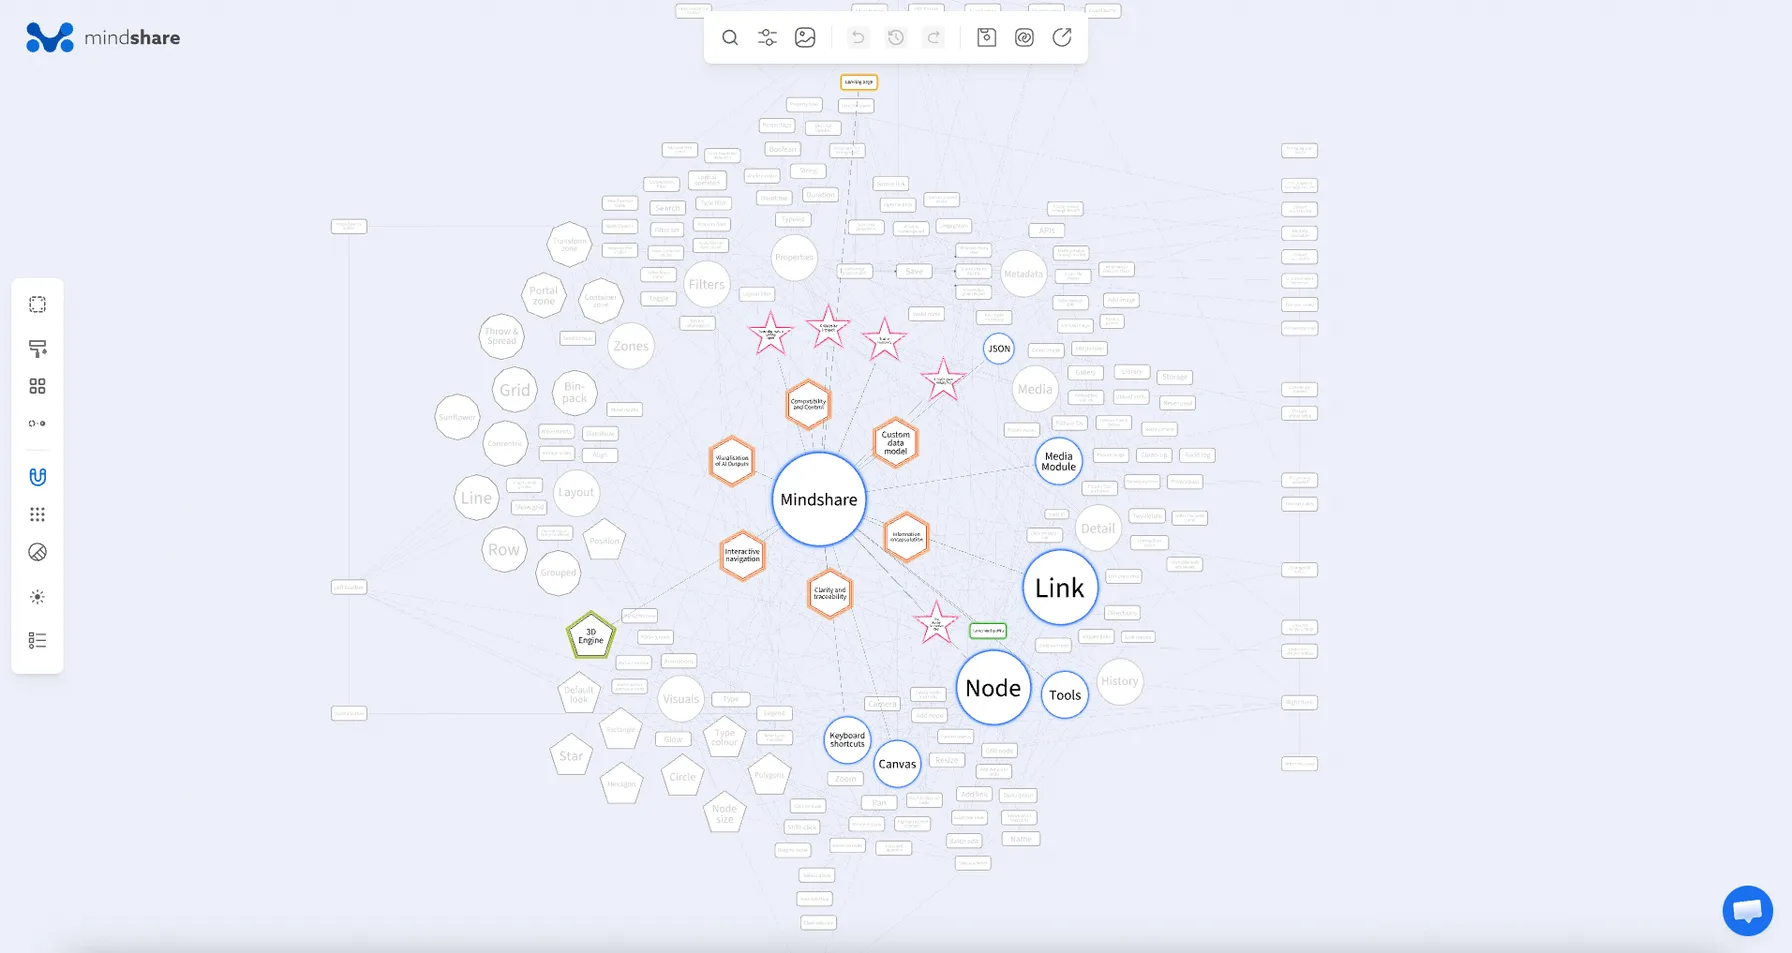
Type is demonstrated in A Website Project
Hover on node is one of Mouse actions
Hover on node achieves Highlight related concepts
Undo and redo has shortcut in Keyboard shortcuts
Search is on Top toolbar
Detail is part of Node
Detail docks in Right dock
Add node is offered in Context menus
String is data type of Properties
Interactive navigation is offered by Mindshare
Row is strategy of Arrange nodes
Link is listed in Detail
Hover on node is an action on Node
Arrange nodes is recorded by History
Circle is a shape in Visuals
Library is a tab of Media console
Description is shown in Detail
Featured use case is shown on Start page
A Website Project showcases Mindshare
Upload successful confirms Import
Add link has a limit in Limits and quirks
Snap to node guides helps Drag to move
Edit node is confirmed with Apply changes
Detail is opened by Click on node
Metadata is stored in JSON
Node is used for Information encapsulation
What is remembered lists as session-only Zones
Metadata stores Connection order
Link names are changed in Edit link
Keyboard shortcuts are shown in Context menus
Canvas displays Node
What is remembered explains Persist on server
Automatic first arrangement follows Import
Cover image is a kind of Media
Gallery is filled by Add pictures
Transform zone is kind of Zones
Resize label text to fit is set in Edit node
Changes not applied protects Two details
Tools provide Interactive navigation
Share link to my view requires Persist on server
This graph is too large to persist warns about Large graphs
Align toolbar appears after Area selection
Graph file shapes are accepted by Import
Visuals are defined in Metadata
Hidden links are followed by Hover on node
Picture values are issued by Media Module
Directions are set in Add link
Filters bring Clarity and traceability
Media can be added to Node
Properties can belong to Node
APIs can run Import
Click on node causes Highlighted node
Resize changes Node size
Graph name comes from Local File button
JSON contains array of Node
Shift-click extends Click on node
Local File button fills Your data box
Toolbar keys gives keys to Top toolbar
Keyboard operation goes with Screen-reader announcements
Top toolbar groups Tools
Filters include Type filter
Media includes Embedded videos
Node is a building block of Mindshare
Name is a property of Node
Canvas is affected by Zoom
Position is changed by Drag to move
Detail is configured by Metadata
Link is created by Add link
Remove from a gallery is done in Edit node
Canvas is filtered by Filters
Align is offered on Align toolbar
Node Types manager is opened from Legend
Graph name is set by Import
Circle is shape of Node
This file can't be opened is shown by Local File button
Loading animation is shown during Automatic first arrangement
Persist on server is triggered by Persist on server button
Graph not available yet marks items in Use case list
Zoom moves Camera
Value inputs per data type offers a range for Whole number
Graph password protects graphs of Use case list
Canvas provides Clarity and traceability
Arranged N nodes reports Arrange nodes
Picture was uploaded reports on Picture files and sizes
Top toolbar sits above Canvas
Left toolbar sits beside Canvas
Keyboard shortcuts speed up Mindshare
Screen-reader announcements accompany Animations
Add image adds Canvas image
Add node adds new Node
Animations animate Visuals
Wrong password answers Password needed
Clickable web addresses appear in Detail
Action messages appear on Canvas
Changes not persisted appears from Title panel
Upload unsuccessful appears in Your data box
Send to zone applies Transform zone
Open access applies to Share link to the graph
Filters are carried by Share link to my view
Filters are carried in Share link parameters
Filters are chained using Logical operators
Properties are changed by Transform zone
Logical operators are chosen in Add filter card
Properties are copied by Copy properties
Picture IDs are copied from Library
Properties are declared in Data types dictionary
Hidden links are demonstrated by Keyboard shortcuts
Properties are displayed in Detail
Zones are drawn on Canvas
Property rules are enforced by Upload unsuccessful
Link names are entered in Add link
Link properties are filtered by Connections filter
Filters are grouped into Filter set
Limits and quirks are limits of Mindshare
Picture values are mostly Picture IDs
Properties are objects details in Custom data model
Tools are part of Mindshare
Visuals are picked by Type
Visuals are rendered by 3D Engine
Graph file shapes are shapes of JSON
Two details are stored in Metadata
Filters are switched by Toggle
Properties are used for Information encapsulation
Filters are widened by Show connected nodes
Picture values are written in JSON
Share link parameters are written into Share link to my view
Link properties belong to Link
Type colour belongs to Type
Detail brings Clarity and traceability
Import brings in Visualisation of AI Outputs
Mouse actions by using Interactive navigation
Polygons bypass Node Types manager
Link can be hidden as Hidden links
Cover image can be replaced by Picture unavailable
Graph password can be sent from API tile
Graph name can be set by Graph creation through the API
Canvas can contain Canvas image
Detail can show Link properties
Node can show a Cover image
Clickable web addresses come from Description
Link connects Node
Filters contribute to Interactive navigation
Your data box contributes to Compatibility and Control
Copy properties copies Node size
Zones panel creates Zones
Picture usage decides what goes with Delete graph
Data types dictionary declares Link properties
Visuals define the look of Node
Node Types manager defines Type
Metadata defines data types of Custom data model
Movements dock in Bottom dock
Right dock docks panels beside Canvas
Bottom dock docks tools below Canvas
3D Engine draws Mindshare
Arrange nodes drives Movements
Upload unsuccessful explains a failed Import
Filters fade nodes with Node Opacity
Double click on node flies Camera
Undone and Redone notices follow Undo and redo
No data available follows a missing Persist on server
JSON format contributes to Compatibility and Control
Properties get types from Metadata
Link gets arrows from Directions
Property rules govern Properties
Password needed guards Persist on server
Changes not applied guards panels in Right dock
Detail has Add pictures
Node has a Position
Detail has settings stored in JSON
Node ID identifies Node
Media is added by Add pictures
Canvas image is added with Add picture button
Node is an object in Custom data model
Canvas is animated by Animations
Paste a picture is another way of Add pictures
Legend filter is applied from Legend
Resize is blocked by Fill small nodes
Filter set is built in Active filters panel
Loading animation is calmed by Reduce motion
Highlighted node is caused by Hover on node
Type is changed in Edit node
Data types dictionary is checked by Upload unsuccessful
Cover image is chosen from Gallery
Value inputs per data type is chosen in Property filter
Position is computed by Automatic first arrangement
Graph name is edited in Graph info
New filter set name is entered in Add filter card
Metadata is explained from API tile
Type colour is explained in Legend
Import is fed by Your data box
Link is followed in Interactive navigation
Link is labelled by Link names
What import does not check is let through by Import
Node Opacity is like the fade of Container zone
Open access is limited by Graph password
JSON is loaded by Local File button
Graph password is marked in Title panel
Property filter is more detailed than Type filter
Filter set is named by New filter set name
Apply filter to node detail is option of Filters
Distribute is paired with Align
Featured use case is picked from Use case list
JSON is produced for Visualisation of AI Outputs
Type is property of Node
Start page is reached from Title panel
Node ID is read-only in Edit node
Persist on server is recorded in Graph info
Detail is refreshed by Animations
Type is selected by Type filter
Graph file shapes is sent in Graph creation through the API
Persist on server is separate from Apply changes
Graph name is set at opening before Persist on server
No data available is shown without Opening a persisted graph
Detail is sorted by Connection order
Type colour is spread by Glow
JSON is the format of Mindshare
Large graphs is the limit of Persist on server
Canvas is the main area of Mindshare
Start page is the start of Mindshare
Picture usage is tracked by Media Module
Concentric is used similarly in Automatic first arrangement
JSON is written by Download
Dock a zone keeps Zones
Filters limit Area selection
Large graphs limits Graph creation through the API
Active filters panel lists Filters
Camera looks at Canvas
Media console manages Media Module
Zoomed out as far as it goes marks the limit of Zoom
Delete graph needs Graph password
Detail offers Click on detail link
Value inputs per data type offers dates for Datetime
Value inputs per data type offers pick values for Typelist
Zones panel opens from Left toolbar
Reorder a gallery orders Gallery
Layout organises nodes on Canvas
Paste a picture places Canvas image
Embedded videos play in Gallery
Shift-click prepares Align
Upload limits protect Media Module
APIs provide absolute Compatibility and Control
Animations provide feedback on Interactive navigation
Import reads JSON
Reusing a picture relies on Media Module
Delete nodes and links removes Link
Remove from a gallery removes from Gallery
Reduce motion replaces Animations
Default look replaces missing Visuals
Movements replays Layout
Filters select nodes by Properties
Select a link selects Link
Resize label text to fit shrinks Name
Picture unavailable stands in for pictures of Media Module
Filters button starts Filters
Import starts on Start page
Undo and redo steps through History
Could not reach the server stops Persist on server
Dock a zone takes nodes off the canvas of Container zone
Visualize button turns into a graph Your data box
Picture upload through the API uploads to Media Module
Delete nodes and links uses Select a link
Opening a persisted graph uses the address made by Persist on server
Widen the Detail panel widens Detail
Snap to node guides works alongside Show grid
Toggle works in Active filters panel
Click on detail link works like Double click on node
Planned layouts (not yet available) would extend Layout