A Website Project
See what went into a website, who made each part and what the client thought of it.
A web project leaves its story scattered across calls, documents, design files and chat channels. This knowledge graph puts one project on one page: the 68 days from the first call to the accepted website, every meeting, task, decision and deliverable, the people who did the work and the client's own feedback at the end.

One project, start to finish
The project runs from left to right through its three phases: brand identity, web design and web implementation. Each meeting, task, decision and deliverable carries the date it happened and its day in the project, from day 1, the introductory call on 10 May 2024, to day 68, the website acceptance on 16 July.
Around that line sit the things that fed it and came out of it: what the client handed over at the start, the people who did each task, the pages of the finished site, and the feedback the client wrote about the team.
Four questions this knowledge graph answers
What did the client hand over?
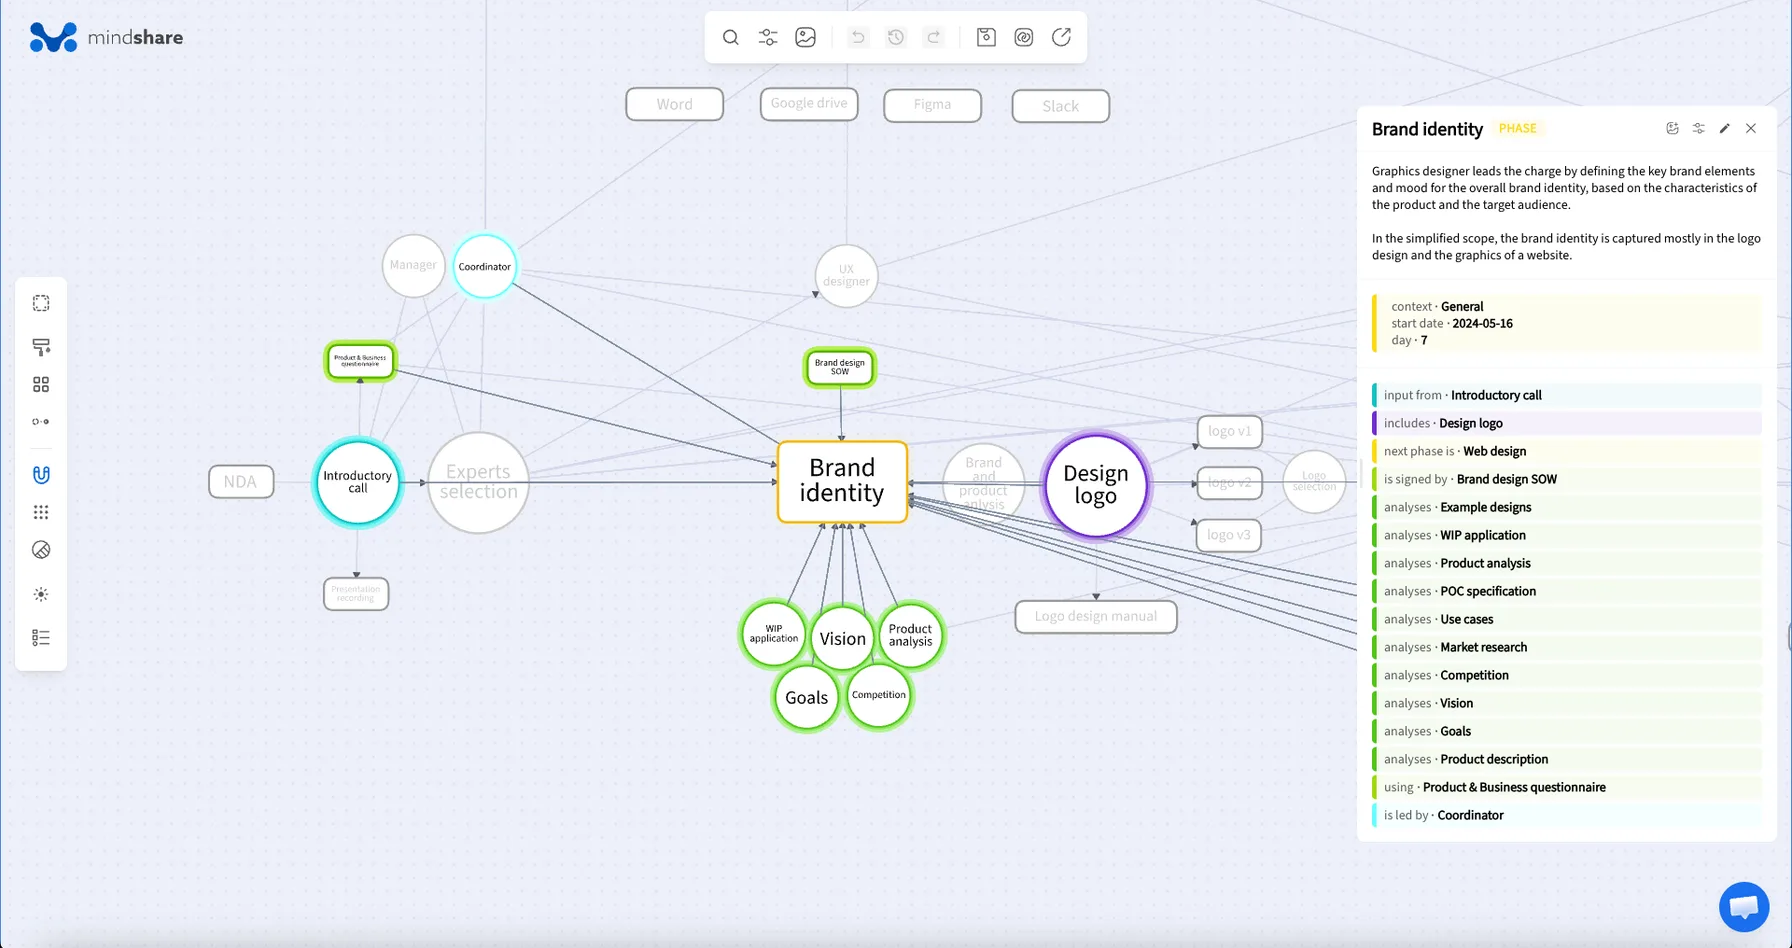
Ten pieces of client material went in at the start: the product analysis, the vision and goals, market research, the competition, use cases, a proof-of-concept specification, a product description, example designs and access to the beta version of the app. All ten fed the brand identity phase.
Only six of them were carried into web design. The vision, the goals, the competition and the beta app stopped at the brand. Web design built instead on what the brand phase produced: the logo and its design manual.
How was the logo chosen?
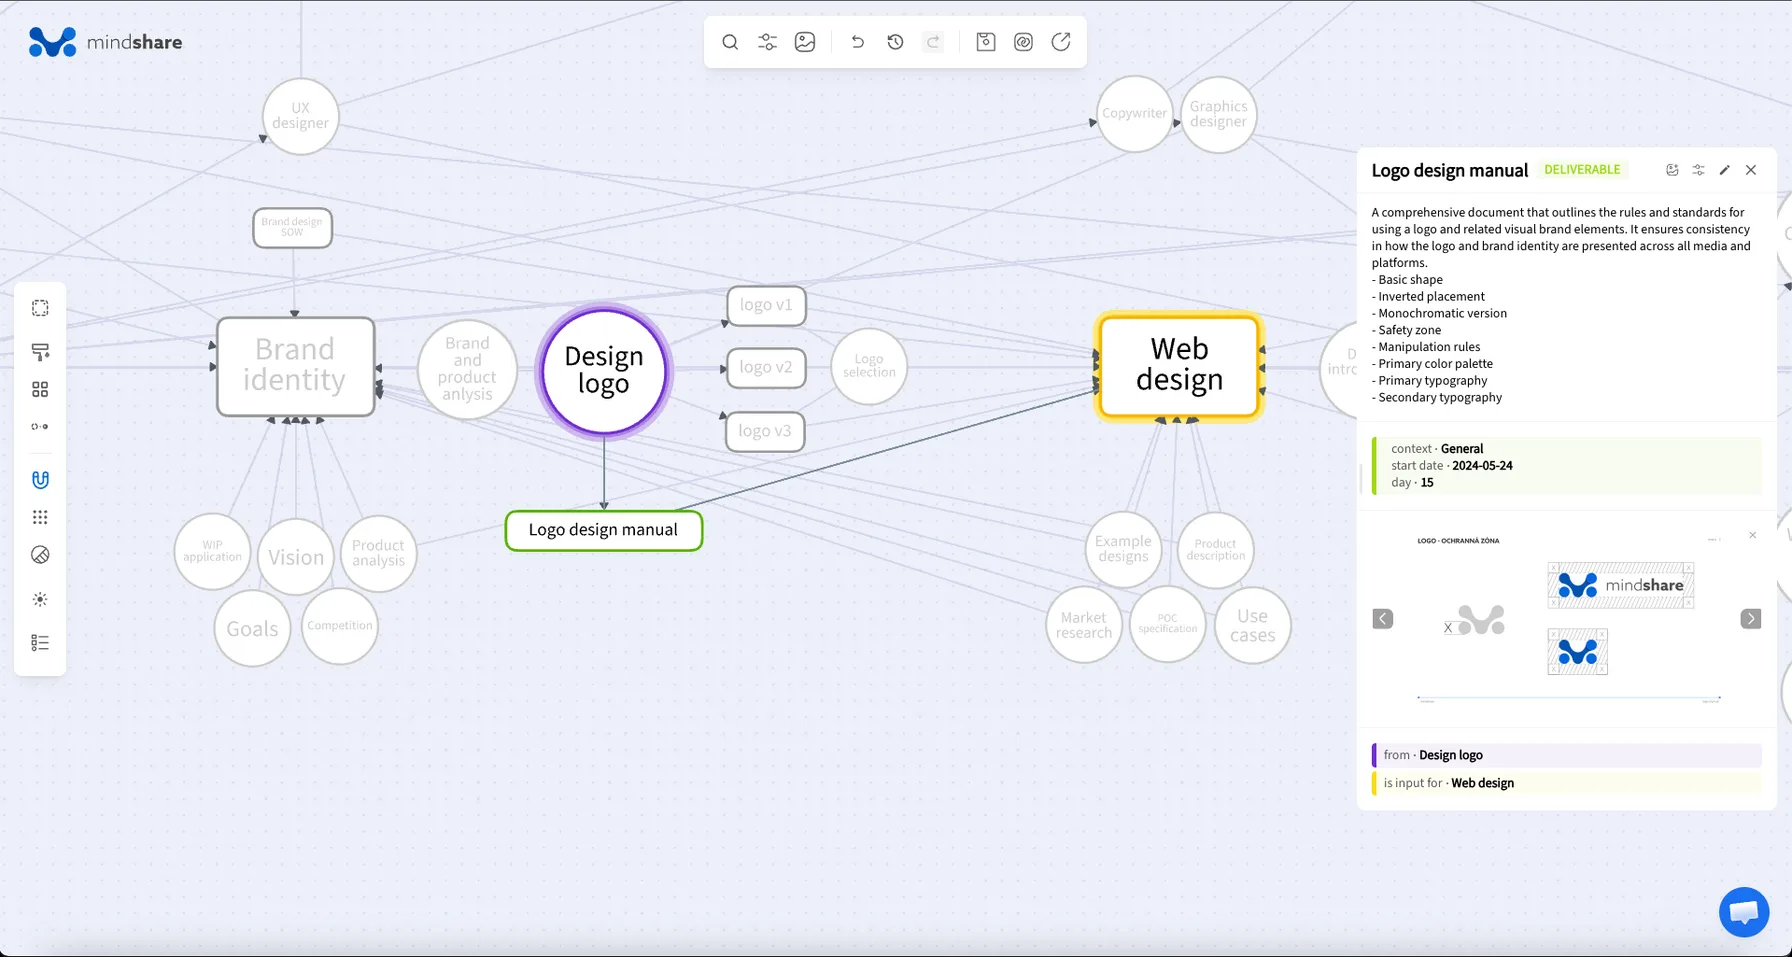
On day 8 the graphics designer started on the logo, working from the client's example designs and a brand and product analysis call. Three versions came back. The selection on day 12 names a winner, a second and a third, and the pictures of each version are kept on the map.
Three days later the logo design manual was delivered: the basic shape, inverted and single-colour versions, the safety zone, the colour palette and the typography. Web design started from it on day 25.
Why this platform?
Two content management systems were on the table: Drupal, open source, and Neoloop, a proprietary one. The choice weighed three things: how far it could be customised for the site's own features and layout, the price, and how easy it would be to maintain. A meeting on day 44 with the web development experts, on the options and their caveats, decided it.
The finished website is built on Neoloop. Its three custom features, a rotating landing-page carousel, image management across the site and a structured Learn section, each needed work in both the page build and the content administration.
What would the client change?
The client left four pieces of feedback. Three are praise, and each hangs off the people it is about: the designers' creativity, the specialists' depth of knowledge, and the coordinator keeping the client involved and the work on schedule.
One is a complaint, and the map shows where it comes from. The client was asked the same questions twice: once in the product and business questionnaire on day 1, and again in the copywriter's discovery questions on day 35. The feedback links both documents, five weeks apart.
How to read the knowledge graph
-
Start at the first call
Click Introductory call, day 1. The client explained the product and the business model, and the team gave an indicative plan. Its connections lead to the NDA that came before it, the recording made of it, the questionnaire that followed and the selection of experts it led to.
-
Follow a phase
Click Web design. It started on day 25 with the design introductory call and ended with the web design acceptance. Its tasks are UX/UI design, the UI and graphics, and the copywriting; it built on the logo and the design manual.
-
Open a deliverable
Click Website UI, day 39. It came out of the UI and graphics task, it used the stock images, 3D assets, SVG logos and source files, and the requirements analysis call for the build was based on it.
-
Check a role
Click Developer. It was picked in the experts selection and did both build tasks, the UI implementation and the CMS and administration. Compare it with Coordinator, which leads all three phases.
-
Look at the tools
Slack, Figma, Word and Google Drive stand apart with no connections. Their descriptions say how each was used, for example a Slack channel for every phase and Figma comments for design reviews.
Map a project of your own
Any client project has the same parts: phases, meetings, tasks, decisions, deliverables, the people who did them and what the client brought in. Make each a type, give the dated ones a date and a project day, and connect each deliverable to the task it came from. Add the feedback at the end, linked to whoever it is about. See how properties and types work, or ask us for help preparing the data.